

Visualize gas flows. Understand risks. Optimize safety in a targeted manner. Safe Supply and Distribution of Hydrogen and Alternative Fuels
When Invisible Gases Become a Safety-Critical Factor
Hydrogen, ammonia, and biogas are key components of the energy transition—but they also pose new challenges in terms of safety, infrastructure, and operations. Hydrogen, for example, has an exceptionally wide explosive limit range of 4% by volume to 77% by volume in air. Even low concentrations can therefore be flammable. This high flammability requires strict explosion protection measures as well as a thorough understanding of gas dispersion, particularly during pressure relief, venting scenarios, or dynamic system switching. Risks therefore arise not only from leaks, but also from the spatial and temporal dynamics of gas distribution.
This is precisely where optical measurement technology comes into play: It makes visible what sensor technology alone cannot detect and provides the basis for reliable decisions in planning, operation, and optimization.

Hydrogen Piping and Material Compatibility
Understanding material behavior under the influence of hydrogen before it becomes critical.
The transition of existing pipeline and supply systems to hydrogen subjects materials to new stresses. Hydrogen can cause embrittlement, microcracking, and altered deformation behavior—especially under mechanical load.
Digital Image Correlation (DIC) makes it possible to monitor these effects over a wide area, non-contact, and under real-world loading conditions. This makes material reactions visible long before safety-critical damage occurs.
For many users in the field of materials testing, this marks the beginning of a new, visual dimension in integrity assessment.
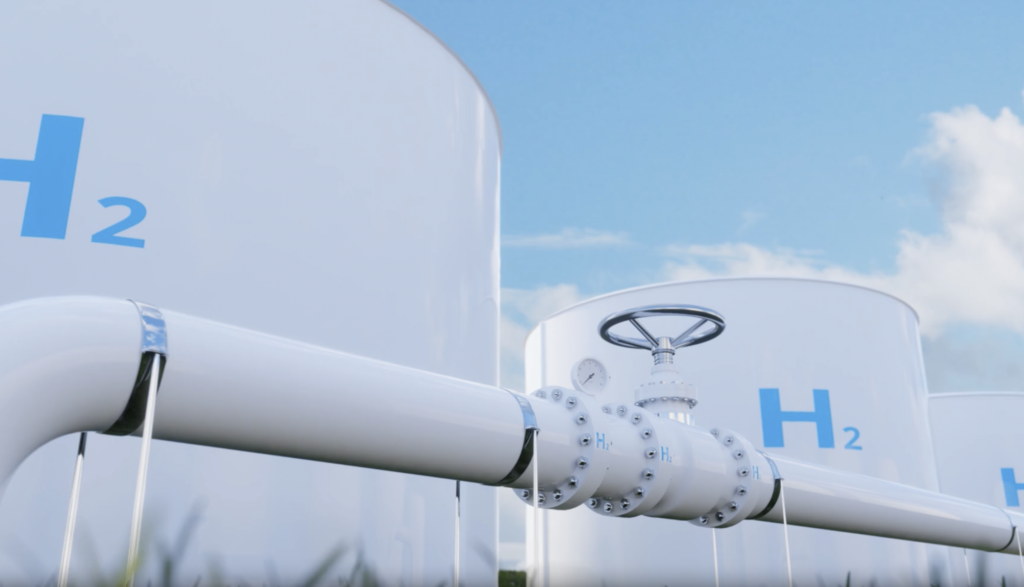
Hydrogen Networks
Safely transforming gas networks, understanding dispersion, assessing risks.
The transformation of existing gas networks to hydrogen requires more than just mathematical estimates. It is crucial to understand actual gas dispersion during normal operation, incidents, and defined safety relief operations.
Optical flow visualization shows how hydrogen spreads from valves, safety relief valves, or leaks, how it interacts with structural elements, and where potentially critical concentrations form.
This measurement data is essential for validating CFD simulations, evaluating protection concepts, and ensuring safe grid operation and regulatory approval processes.

Hydrogen Systems & Handling
Safely transforming gas networks, understanding dispersion, assessing risks.
The transformation of existing gas networks to hydrogen requires more than just mathematical estimates. It is crucial to understand actual gas dispersion during normal operation, incidents, and defined safety relief operations.
Optical flow visualization shows how hydrogen spreads from valves, safety relief valves, or leaks, how it interacts with structural elements, and where potentially critical concentrations form.
This measurement data is essential for validating CFD simulations, evaluating protection concepts, and ensuring safe grid operation and regulatory approval processes.

Safe Release of Hydrogen and Other Gases
Why Visualization Is the Crucial Step
While traditional detectors indicate that gas is present, a question critical to safety assessment often remains unanswered: How does it actually spread?
Optical flow visualization reveals the direction in which released gases move, how buoyancy, flow velocity, and environmental conditions influence their dispersion, and how gas clouds interact with plant components or structural elements. This provides a spatial and temporal understanding of the actual gas dynamics, particularly during dynamic processes such as venting, pressure relief, or unintentional releases.
To make these processes visible and analyzable under real-world conditions, LaVision combines optical imaging with specialized analysis and visualization. The following FlowBOS camera systems translate this approach into a scalable solution for laboratories, test environments, and industrial applications.

Learn more about FlowBOS camera systems

Integration into the broader context of sustainable energy sources
The analysis of supply and distribution is an integral part of the sustainable fuels value chain and, at LaVision, complements the study of gas distribution, combustion, emissions generation, and material integrity throughout the entire process chain:
- Fuel Mixture and Carburetion
- Combustion Processes and Emission Formation
Only the interaction of these levels enables the comprehensive optimization of safe, efficient, and sustainable energy systems.